The Dashboard answers "how are we doing right now"; Analytics answers everything else. Open Analytics from the sidebar to reach the report hub. Every report respects your scope: branch managers see their branch, organisation admins see the whole organisation.
Who this chapter is for: branch managers, administrators and organisation admins.
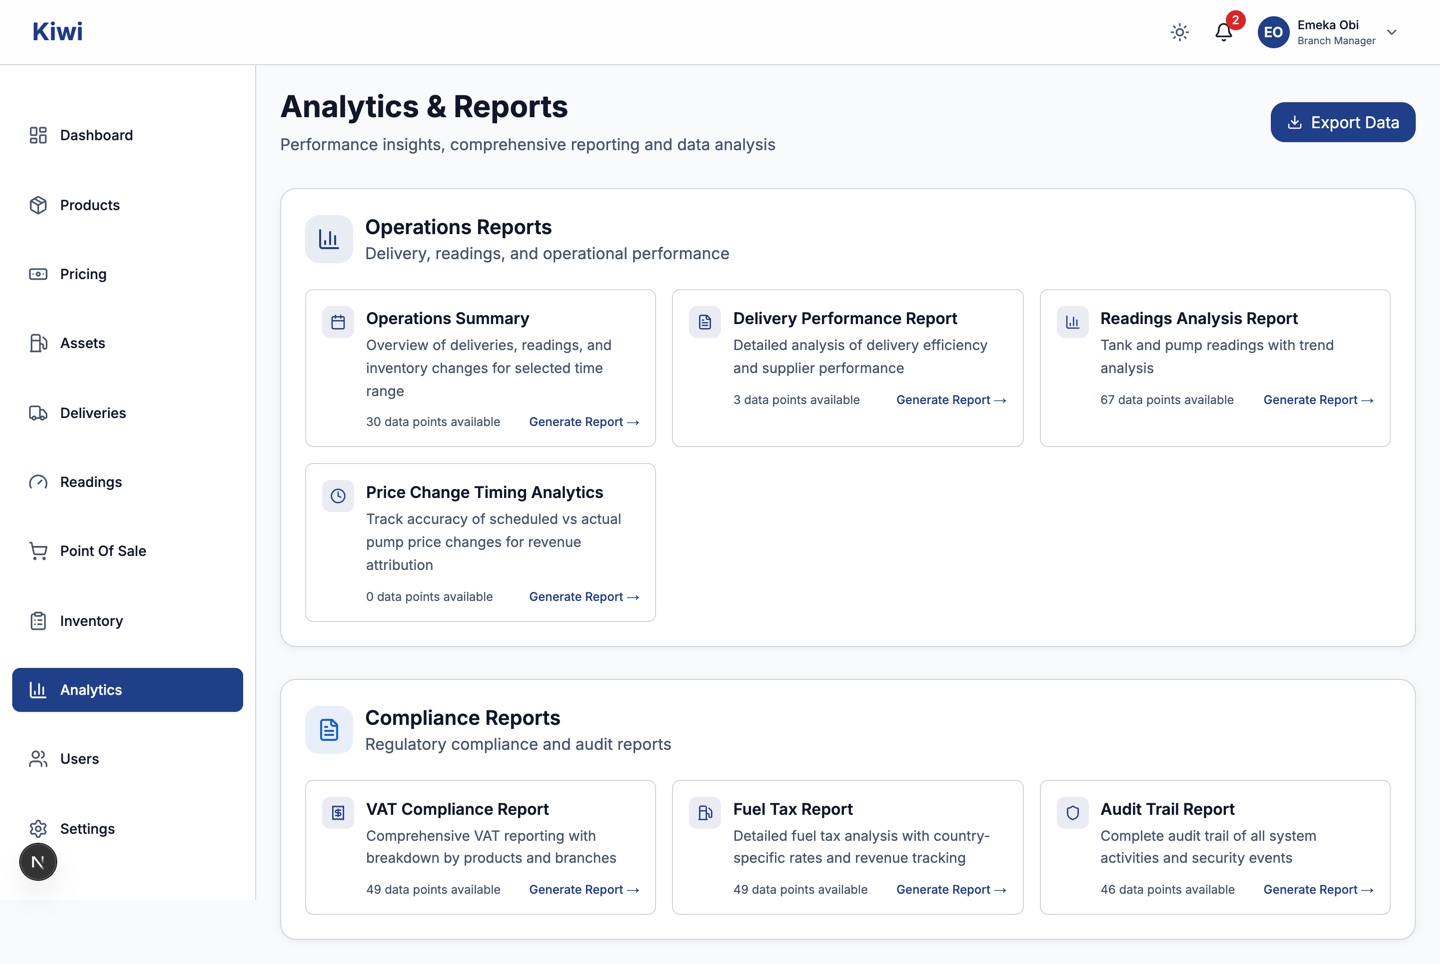
Operations reports
| Report | The question it answers |
|---|---|
| Operations Summary | What happened across deliveries, readings and inventory in a chosen period? The starting point for a weekly or monthly review. |
| Delivery Performance Report | How efficient are our deliveries and how do suppliers compare? Looks at variances between expected and delivered quantities over time. |
| Readings Analysis Report | Are readings being taken consistently, and what trends do the tank and pump readings show? Useful for spotting gaps in reading discipline before they become reconciliation problems. |
| Price Change Timing Analytics | When we scheduled a price change, how accurately did each branch submit its meter snapshots? Shows on-time, early and late submissions per branch, so head office can see where revenue attribution is at risk. |
Compliance reports
| Report | The question it answers |
|---|---|
| VAT Compliance Report | How much VAT is embedded in our sales, broken down by product and branch? Built for filing periods. |
| Fuel Tax Report | What fuel tax applies to our volumes, using the rates configured for our country? |
| Audit Trail Report | Who did what, and when? Every significant action in Kiwi is logged with the user, time and context. Use it for incident investigations and external audits. |
Exporting data
Export Data at the top of the hub opens the export tool for raw data downloads. Individual reports also offer their own exports where applicable. Exports are the bridge to whatever spreadsheet or accounting workflow your organisation already runs; the RTT history export (see the Daily Operations chapter) and inventory stock level export (see the Inventory chapter) live on their own pages.
Getting trustworthy numbers
Reports are only as good as the operational data underneath them. If a report looks wrong, work backwards:
- Check the period and branch filters first.
- Check reconciliation for the period (Inventory chapter); an unresolved variance flows into every downstream figure.
- Check for missed readings or missing deliveries in the Operations Summary.
- Check that prices existed for the whole period; sales without an effective price cannot be valued (Pricing chapter).